Streaming continues to supplant music sales: Nielsen mid-year report
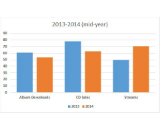
Nielsen Soundscan’s annual mid-year report, issued each June, shows the first half of 2014 continuing a definitive consumer migration from purchasing albums to streaming songs. The main takeaway from Nielsen’s mid-year report is that the trend toward streaming appears to be accelerating. In January, Nielsen’s full-year report of 2013 indicated 32% growth in streaming compared to 2012. In 2014, the year-over-year pace is +42% rise in streaming at the year’s midpoint. Continue Reading