Earlier this week we reported the mid-year update from the Recording Industry Association of America (RIAA), which tabulates revenue for the U.S. recorded music industry. That report broke new ground with the highest dollar amount in the span of the RIAA’s public reporting period (1973-2023).
That is one way of looking at music revenue across the 50-year stretch. But a different reality emerges when we consider relative dollar value. The RIAA encourages this second view, and offers a one-click revision of the 50-year chart on its page. (See HERE.) We present a comparison below.
First, RAIN’s chart which places the two trend lines against each other, starting in 1999. We chose that year because it represents the NON-adjusted highest level of music revenue.
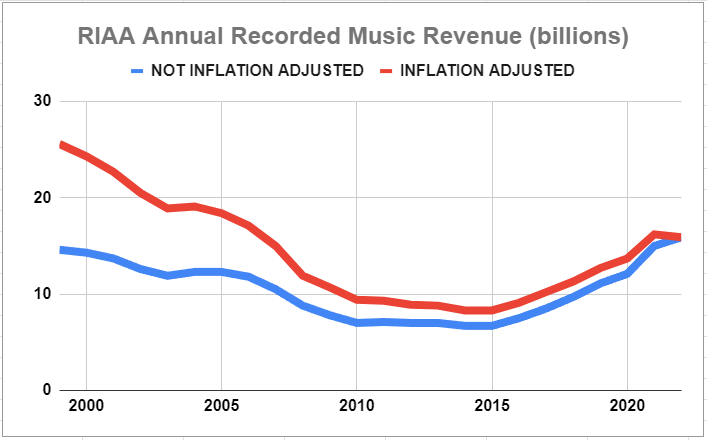
In the blue non-adjusted line above we see record-breaking performance in H1 2023. The red line adjusts for inflation, showing 1999 as the high-water mark.
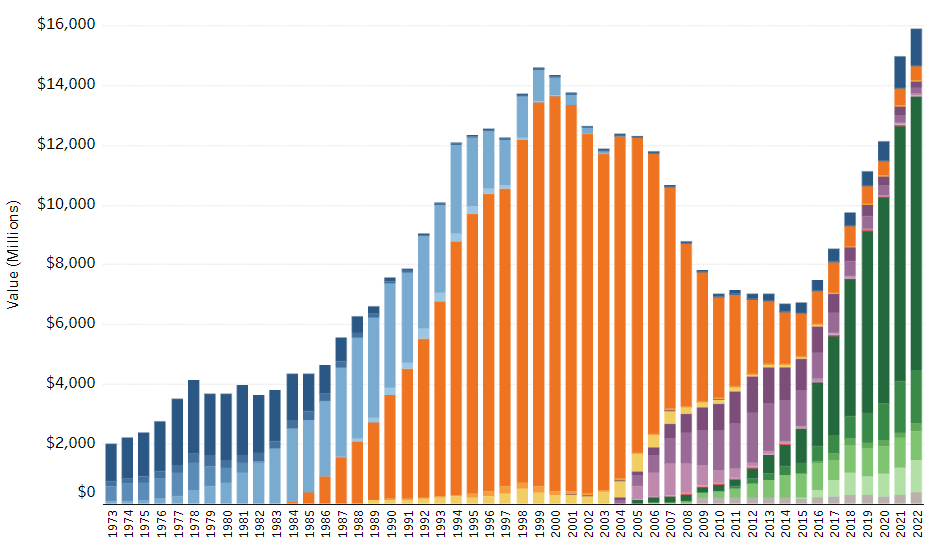
Using the RIAA’s website chart adjustment, we see another way to view the entire trendline, showing both this year and 1999 in a larger perspective. First, the unadjusted RIAA view:
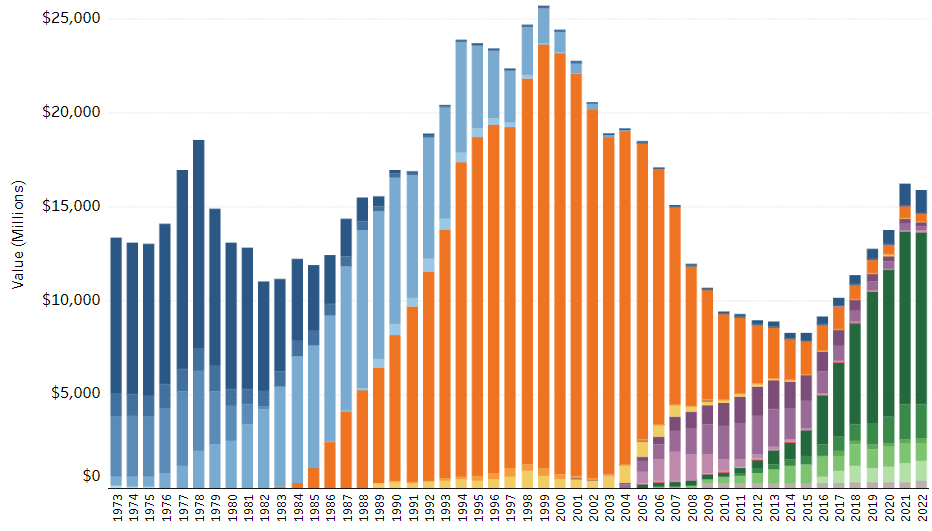
And below, the inflation-adjusted RIAA view, showing 2023 in a new perspective:
(Thanks to Russ Crupnick, Managing Partner, MusicWatch)