![]() After sharing some of the Stitcher Podcasting Report 2021 (see coverage HERE), we return today to look at Part 2 of the interesting release. This report (get it HERE) examines listening and user metrics within the Stitcher app, which, because of its popularity and scale, might be considered a guide to user tendencies at wider scale.
After sharing some of the Stitcher Podcasting Report 2021 (see coverage HERE), we return today to look at Part 2 of the interesting release. This report (get it HERE) examines listening and user metrics within the Stitcher app, which, because of its popularity and scale, might be considered a guide to user tendencies at wider scale.
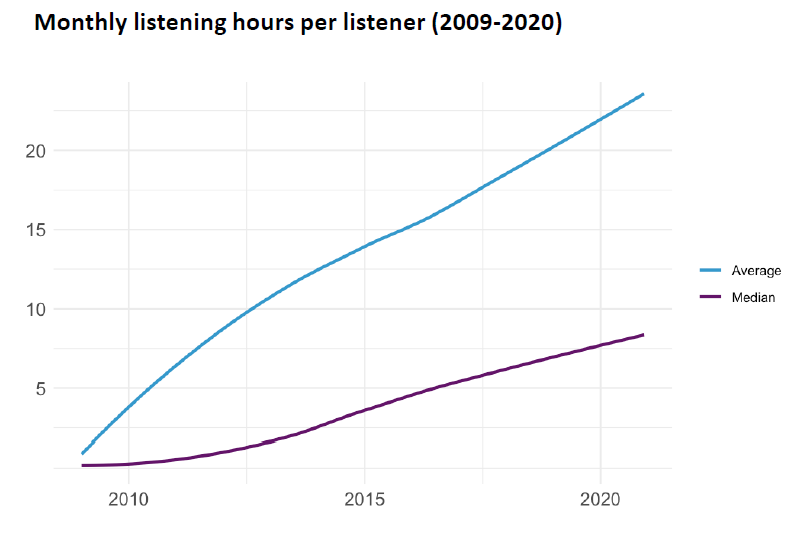
Much of Part 2 is devoted to analyzing hours spent listening — how many, at what times, and type of listeners. Naturally, in a report of 2021 metrics, Covid plays a part. Podcast listening hours dipped in Stitcher, then recovered, during Covid, as expected and exhaustively reported in other measurements. Perhaps more interesting is a longer view of monthly listening hours over 11 years, in which we see spectacular growth in monthly listening hours — and it’s important to know the chart below is a per-listener measurement:
 Digging into 2020, we can see how the voracious appetite for podcasts is fueled. In the chart below, dark blue indicates percent of total Stitcher users; light blue indicates percent of total listening hours.
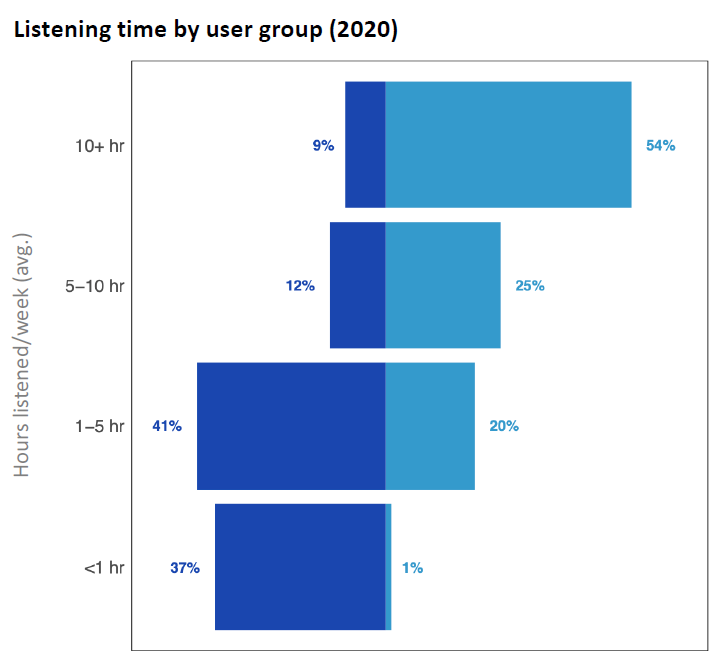
Dark blue indicates percent of total Stitcher users; light blue indicates percent of total listening hours.
So, the big appetite is driven by a small percentage of power listeners. Seventy-eight percent of users drive less than one-quarter of listening hours (21%), while less than one-quarter of users (21%) drive over 75% of hours (79%).
.