Radio’s weekly reach holds steady year-over-year, but smartphone use (where radio is difficult to tune in) dramatically increased.
Nielsen released its comparable metrics report for Q4 2015. Radio’s weekly reach held steady at 93% for all adults over age 18. Although the overall numbers for radio appear to be sticking at the high levels put forth in Q3, there are underlying metrics that point to big shifts stemming from smartphones and the habits of younger listeners.
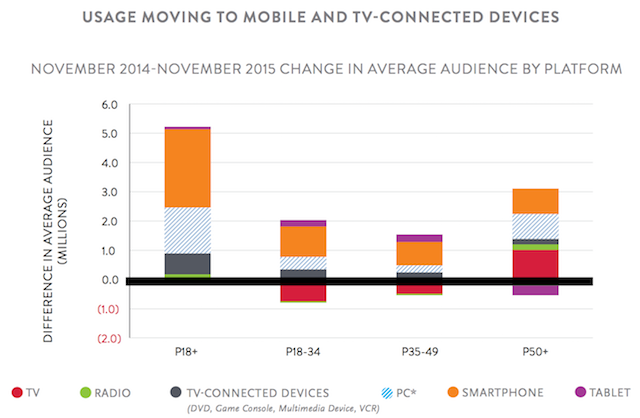
Radio use by age group
Radio posted a small amount of audience growth among all adults, but the 18-34 and 35-49 age groups actually posted a negative change in Nielsen’s Average Audience metric. The overall growth was motivated just by an increase in the over-50 age group. PCs, TV-connected devices, and smartphones all saw positive changes across the demographics. Overall smartphone use saw the largest increase in Average Audience between November 2014 and November 2015.
The 18-34 age bracket had an average of 10 hours, 52 minutes of time spent listening to radio weekly, compared with more than 13 hours for both the other groups. Both the 18-34 and 35-49 groups had roughly 11 hours spent with smartphones per week. These results showed the outcome of how younger listeners are increasingly turning to their phones for media, which we’ve been seeing in other research too.
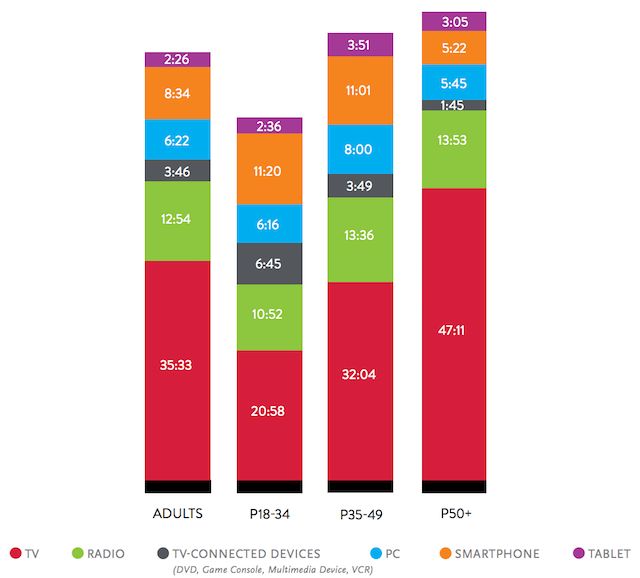
Time spent with radio (in green) is sharply lower for the 18-34 group, than older groups. Part of that shift might be increased us of smartphones among young consumers.
The charts showing gross minutes listened to different platforms backed that trend. For an average Q4 week in 2014, the 18-34’s gross minutes with radio were 48.02 billion, which dropped to 47.48 billion in 2015. PC streaming audio time for the demographic rose from 826.93 million to nearly 860.55 million minutes. Total time spent with smartphones increased from 39.22 billion minutes to almost 49.51 billion minutes, while smartphone audio streaming spiked from nearly 1.83 billion minutes to almost 3.03 billion minutes.
Other trends
Across all adults surveyed, a few other trends emerged. PC streaming audio use shifted from an average of 2.38 days per week, 32 minutes per day, in 2014 to 2.24 days per week and 43 minutes per day. Gross minutes fell slightly from 1.883 billion to 1.879 billion. Streaming audio on smartphones for all adults showed impressive growth, from 3.92 billion gross minutes to 6.24 billion minutes. That paired with a change from an average 2.73 days per week and 22 minutes per day on average in 2014, to 2.91 days per week and 27 minutes per day.
An important note on methodology for these Nielsen report. Measurement of streaming audio on PC includes music played in the foreground of the screen, but does not include YouTube and Vevo. It also doesn’t include pages in the background or that have been inactive for more than 30 minutes — those measurement decisions might lead to under-measurement of PC audio streaming, but those restrictions are not applied to desktop apps like Spotify or Apple Music. Smartphone and tablet metrics for streaming also do not count YouTube, Vevo, or other video platforms.