In a jolly infographic, audio research and analytics company Veritonic lays out some data to help shape holiday advertising strategy. Audio Is The Gift That Keeps On Giving, it’s called, and is freely available HERE.
The work is based on a Veritonic survey of 300+ U.S. individuals who listen to podcasts and streaming audio at least once a month. Sixty-two percent of them listen through their phones; 18% via computer; 10% in their cars; four percent over smart speakers.
The results were presented in a Veritonic webinar. Following are some of the key listener preferences and tolerances when it comes to holiday audio ads:
- Engaging with Holiday Music: Holiday ads become more engaging when they include holiday music, according to 76% of listeners.
- Voice Matters: The voice(s) in an audio ad can significantly impact purchase decisions, as 68% of listeners noted.
- Ad Duration: 55% of listeners say the duration of an audio ad affects their purchasing decision, with 48% preferring ads between 15-30 seconds and 30% preferring ads of 15 seconds or less.
- Holiday Sound Effects: Incorporating holiday-themed sound effects into audio ads can make 62% of listeners more likely to make a purchase.
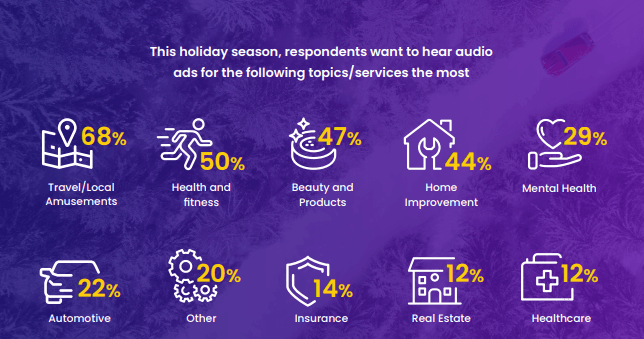
- Preferred Ad Verticals: The verticals that listeners want to hear from most this holiday season include Travel/Local Amusements (54%), Health and Fitness (50%), Beauty and Products (47%), and Home Improvement (44%).
- Celebrity Voice Overs: Surprisingly, 52% of listeners claim that celebrity-voiced holiday ads have no impact on their purchase intent compared to non-celebrity ads.
- Discount Codes Desired: 76% of listeners want audio ads to contain discount codes during the holiday season.
In what might be a good-news, bad-news results– depending on ad advertiser’s expectation — 50% of respondents listen all the way through an ad without skipping forward. In a related statistic, 43% listen for a few seconds to hear if an ad is relevant to them.
Travel and Health are top of mind to respondents:
Again, the infographic is HERE.