Podcast verification and attribution company Podscribe has released its quarterly Podscribe Performance Benchmarks, which offers analyses of key performance indicators important to podcast advertisers.
Many of the increases and decreases measured between Q3 and Q4 are negligible; they don’t offer solid trends for the short quarter-to-quarter time frame. But they do shine light on basic podcast ad performance indicators, and that’s important to current and potential advertisers.
Some measurements in this 16-slide deck are important as snapshots, regardless of Q3-Q4 changes. One example is Podscribe’s comparison of digital ad insertion (DAI) and baked-in (often host-read, though not necessarily) ad types. DAI suffers in that comparison, when measuring the rate of visitors to the advertiser’s destination — baked-in ads are 21% stronger at that metrics, as illustrated below:
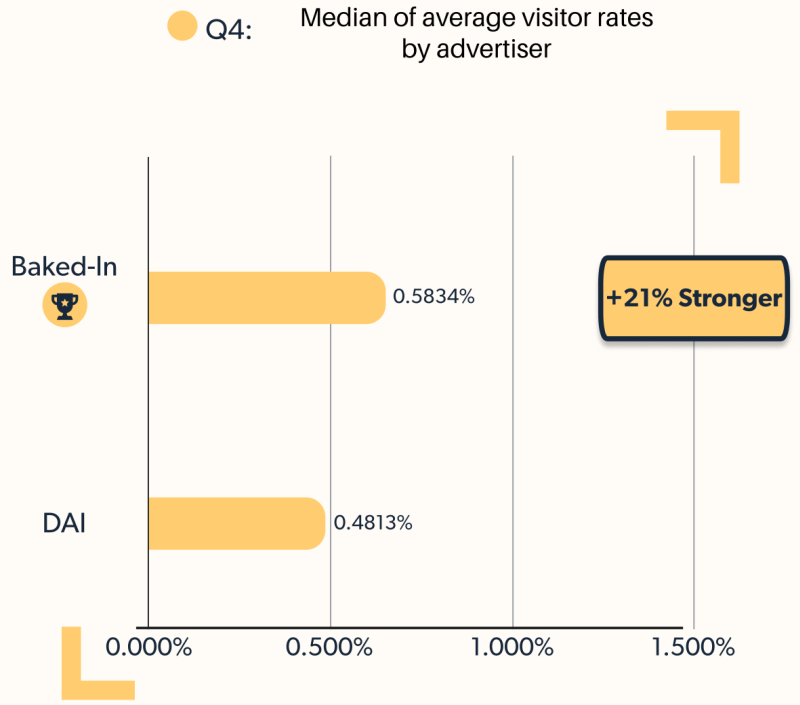
That metric notwithstanding, the baked-in advantage dropped from 35% in Q3 to 21% in Q4.
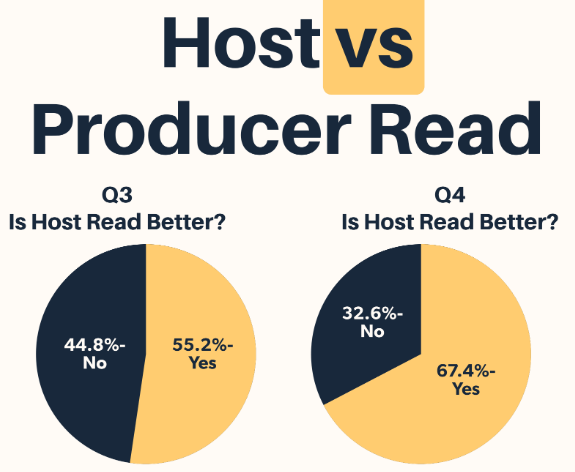
In a related finding, Podscribe drilled into host reads particularly, comparing their effectiveness with “producer reads.” In Q4, the host-read ads — which are famously the most personalized type of podcast advertising — were deemed better, based on visitor rate, by more than two to one:
The study continues with measurement of other variables that marketers might contemplate: The best day of the week (Wednesday), the best ad length for driving visitors, a ranking of show genres for driving visits (Tech is #1), and how podcast ad visitor rates compare to streaming (favorably).
This is all clearly presented, and does not take all day to consume. Recommended; get it HERE in exchange for your email.