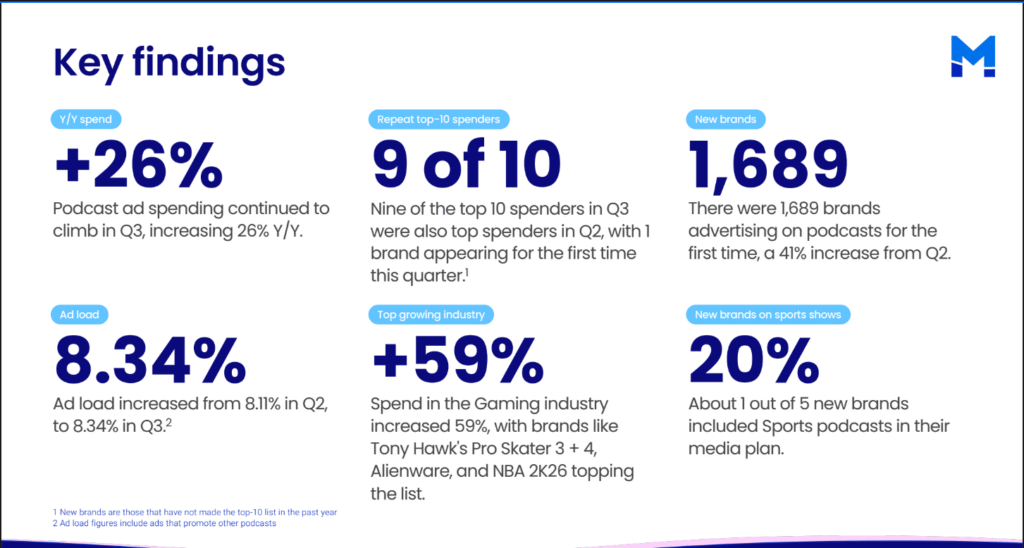
Podcast advertising analytics platform Magellan AI has released the Q3 edition of its quarterly podcast advertising benchmark report. In it, we learn that Q3 spending rose compared to Q2, and also compared to the previous year’s Q2.
We also learn:
- Most of the top spenders appear in both reports.
- More new brands joined the fray. Ad load increased.
- The gaming industry was ravenous for podcast ad spots.
- Twenty percent of new brands bought ads in sports podcasts.
The graphic below details those headline findings.
Who is spending?
We compare the Q3 report with Magellan’s Q2 details, and nine of 10 companies appearing quarter-over-quarter. (In parentheses, we show the chart positions in Q2 – Q3.)
BetterHelp (1 – 1)
Amazon (2-3)
Toyota (3-5)
Quince (4-4)
FanDuel (5-8)
DraftKings (6-10)
Shopify (7-7)
T-Mobile (8-6)
State Farm (10-9)
Growth
Looking at industries provides a more generalized view than with individual companies. Magellan does that work, identifying the five industries with the largest budget increases — not total spend, but increased spend — from Q1 to Q2. We observe the following:
- Gaming (+59%)
- Dating (+41%)
- Transportation (+41%)
- Phone, Internet, Cable (+27%)
- Feel (+23%)
Spend
Spending increase is one metrics (above); total Q3 spend is another, and Magellan identifies Financial Services as the biggest spender, having inveted 89.6 million dollars in Q3 and uptick of eight percent over Q2.
Other measurements
These quarterly releaes from Magellan are intriguing in their detail. For example, we discover the following about new brands entering the space in Q3:
- 1,689 new brands
- Average spend: $33,900
- Average spot length 49 seconds
- Most frequent placement: Mid-roll
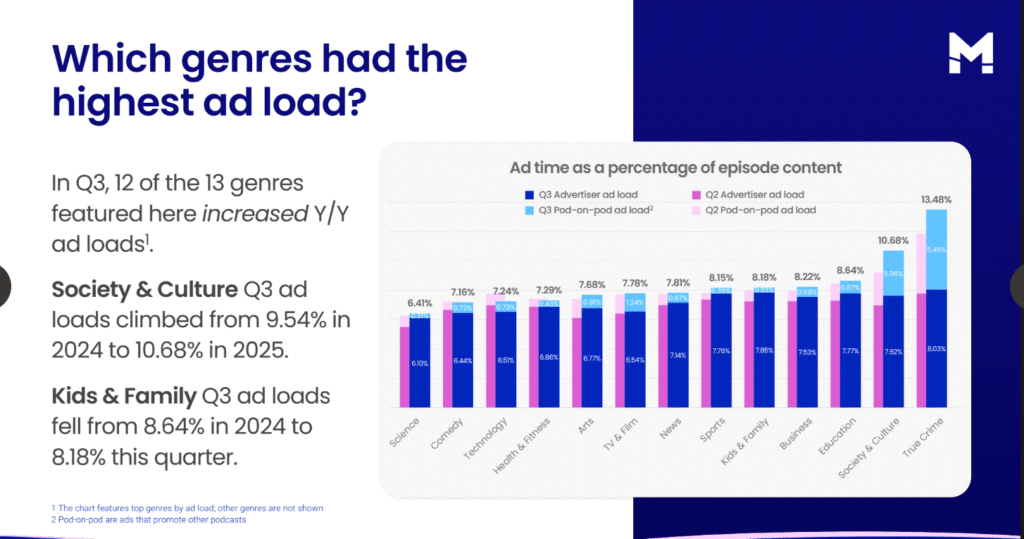
We learn that about eight percent of episode time is given to advertisements — that includes brand advertisers and “pod-on-pod” promotions. The short-term quarterly history of this metric is stable; no trend is discernable over five quarters.
There’s hardly a podcast research piece which fails to highlight True Crime as a dominant show category, one way or another. Here, Magellan charts ad time as a percentage of episode content. That’s an interesting metrics, and really interesting when you look over to the right:
Magellan carve out several intriguing data enlightenments we haven’t mentioned. As always, the source rules. It is HERE.