In a new survey presented by the Podcast Marketing Academy and Lower Street, supported by 10 podspace companies, we learn about:
- Publishing frequency according to level of growth
- Growth characteristics in shows of different lifespans
- Growth characteristics in shows with different audience sizes
- Publishing frequency metrics
- Year-over-year audience growth and reduction metrics across the entire field
- Growth rate benchmarks
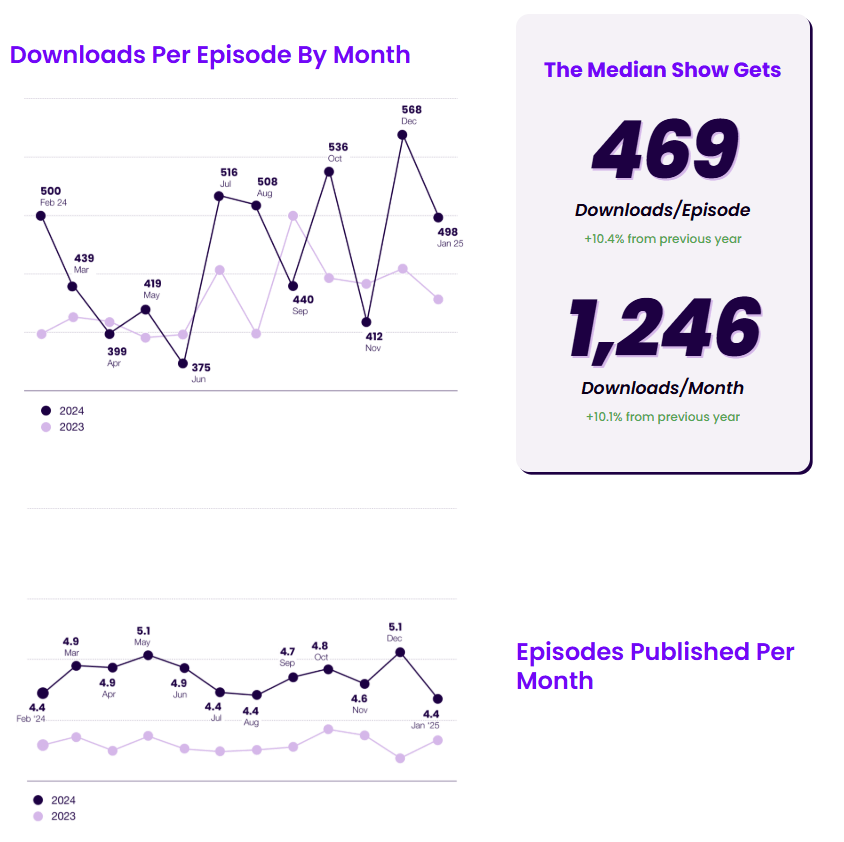
- Download metrics by month , including year-over-year

Fast Evolution
“Podcasting is changing fast” — that is the chief thesis of this production. The report contains recommendations, metrics, and self-promotions about what it takes to market, grow, and profit from the contemporary podcast channel.
The Field
The underlying survey queried 311 podcasters and other podfessionals representing diverse backgrounds and positions in the industry. The content represented by the surveyed group contained over 50,000 published episodes and over 3.7 billion downloads.
The respondent field was divided almost exactly 50/50 between audio only pods and audio-plus-video.
The fieldwork was executed in Q1, and is described as “a sadistically long and detailed survey.”
All About Growth
The main focus of this work is to identify the differences between high-growth and low-growth shows, regardless of size. A secondary focus was the difference between big shows and smaller ones. There was a wide success differential within the focus group, ranging from over one million downloads per episode to fewer than 100.
Basics, Year Over Year
Two of the most fundamental podcast publishing characteristics are:
- Number of downloads (per episode and per month)
- Number of episodes published per month
For both of these, the Podcast Marketing Academy has graphed 11-month year-over-year trends (below). These metrics compare 2024 to 2023. Note that downloads per month, the first graph, shows a wild tango of metric points above and below the previous year. IN the second graph we see a steady growth of episodes published per month, for each month.
There is much more to this abundant report. We will revisit it, but in the meantime the whole thing is freely available HERE.