


![]()
The headline points are these:
- More advertisers appeared in the Q1 testing;
- Fewer ads were presented, and the timed ad load was lower on average;
- The 30-second format was even more present than in the 2014 report.
The major enhancement of the Q1 report is a fifth streaming publisher added to the measurement stack. As with the earlier version, the streaming outlets are not named. Regarding that reporting tactic, the document says: “The intent is not to zero in on the ad serving strategies of any particular service, but instead to reveal the variety of approaches as well as industry-wide trends.”
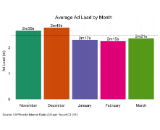
Streaming audio presents a much less crowded advertising experience to listeners than broadcast radio, generally speaking, and that experiential advantage increased the XAPPmedia’s Q1 measurements. The average ad load per hour dropped from 2:44 in Q4 to 2:21 in Q1. the number of units also fell, from an average of 6.5 in Q4 to 5.2 in Q1.

Number of spots per hour also fell substantially quarter-over-quarter. The average number of ads (all lengths of creative) dropped 22% from Q4 to Q1. (That metric eliminated the fifth publishers added in Q1; figuring in all five outlets didn’t change the drop much.) Of the five months broken out across two quarters, February showed the lowest average number of spots (4.8).
A very interesting metrics from XAPPmedia in both reports is “TTFA” (Time To First Ad), which certainly affects the user experience in ad-supported Internet radio. That experience is especially underlined when compared to broadcast station webcasts, which, when simulcast, sometimes put the listener into the start of an eight-minute ad break, first thing. Again, user experience gained ground in Q1, as the average TTFA rose to 13:41, from 11 minutes in Q4.
XAPPmedia’s measurements showed an increase in advertiser participation, with the number of unique advertisers growing from 77 in Q4 to 118 in Q1. A total of 165 advertisers have been identified during the two-quarter testing period.