
This file examination can detect number of ads, an estimate of downloads, cost of advertising per thousand plays (CPM) type of ad (e.g. host-read or produced), and whether ads are delivered programmatically or purchased directly.
With all this established, Magellan leads its presentation with the always crucial Key Findings — the standard bottom line of quantitative assessment. Those findings are below:
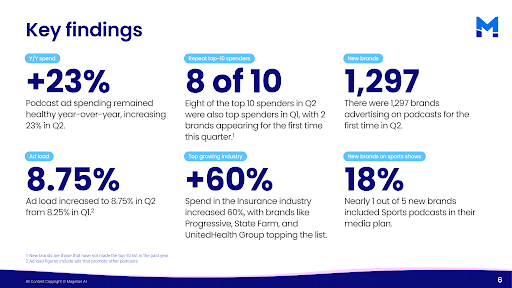

Amidst the general uplift shown in the graphic summary above, we observe with interest the final point:
Eighteen percent of new brands included sports podcasts in their media plans.
Digging in a bit, we learn (HERE) that sports is the second largest podcast genre by ad revenue, amounting to 13% of all spend in the U.S. Listeners are avid buyers, spending an average of $321 per year.
As long as we’re picking the most enthusiastic industries, we see that the insurance business increased its overall spending by 60% over the past year.
Top Spenders
Magellan creates a top ten list of quarterly spenders. In this edition we see e-commerce manufacturer-to-consumer company Quince at the top spot, having spent 19 million dollars. Here, the entire top ten:
- Quince — $19M
- Shopify — $15.7M
- BetterHelp — $15.6M
- Toyota — $15.6M
- Amazon — $12.5M
- T-Mobile — $11.900M
- FanDuel — $11M
- Progressive — $9.8M
- SimpliSafe — $9.4M
- Public.com — $9.4M
There’s a good deal more to Magellan’s report. A thorough perusal will glean, in addition to what we’ve documented here:
- the biggest business industries by spend
- podcast categories with highest ad load
- how much advertisers are spending on “big shows,”
- a look at last year’s Q3 data to prepare for this year’s Q3, which podcast genres had the highest ad load (True Crime leads the pack, unsurprisingly)
…and a lot more. Get it HERE.