
 The New York Times has published a data visualization comparing the popularity of top artists across the U.S. The publication used a cross-section of Billboard’s Top 100 artists and YouTube viewing data to create heat maps of where those performers are listened to the most (and the least). The artist maps offer insight into where and how some newer big acts got their surge to the top, who is keeping the familiar names atop the charts, and which regions have the most die-hard fan support for local heroes. And yes, there are some interesting surprises.
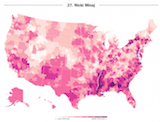
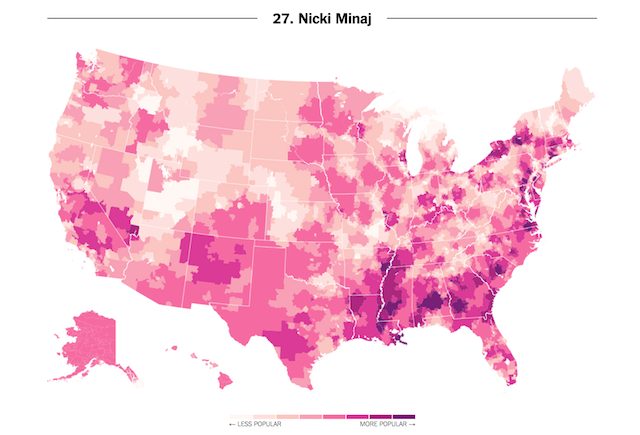
From a casual look, the southeastern states seem to have the most strongly defined tastes. Rap artists, particularly local talent, lit up the corridor below the Mason-Dixon line. Performers who excelled there usually didn’t have big sway in other regions. The exceptions were most commonly crossovers, such as Rihanna’s pop influence or DJ Khaled’s dance music. One of the most fascinating maps is for Kevin Gates. He’s an up-and-coming rapper from Louisiana, and you could guess that from his map. The state is covered in the darkest mauve color, and radiates outward in nearly perfect waves of increasingly paler circles.
Despite modern rhetoric about “coastal elites,” the west and east coasts didn’t share much common ground in this analysis. California is all about Bruno Mars and The Weeknd while the northeast had the heaviest concentration for The Chainsmokers.
However, some artists did have the strongest sway over the western bloc of Utah, Idaho, Montana, and their neighbors. Many of the most popular artists there have or had some ties to Christianity, such as Katy Perry and Twenty One Pilots. Other successes tied to this region are more surprising: both Taylor Swift, Imagine Dragons, and Maroon 5 have big fan bases there, even though their music and lives aren’t always so wholesome.
The end result here is still a compelling look at not just geographic tastes in audio, but also video. When YouTube is a factor in your assessment, you’re analyzing the visual presentation as well. It’s a potent reminder that just because MTV isn’t showing music videos any more doesn’t mean that the format is dead or unimportant.


This is very fascinating, You’re a very skilled blogger.
I’ve joined your feed and stay up for in search of
extra of your excellent post. Also, I have shared your site in my
social networks