![]() Research and consulting firm Atenga released a study of consumer demand for streaming music services. Atenga is a consumer intelligence platform with a specialty in pricing strategy. The purpose of this study was to find optimal price/revenue points for several online music services, and drawing broader points about what consumers are willing to pay for music streaming.
Research and consulting firm Atenga released a study of consumer demand for streaming music services. Atenga is a consumer intelligence platform with a specialty in pricing strategy. The purpose of this study was to find optimal price/revenue points for several online music services, and drawing broader points about what consumers are willing to pay for music streaming.
Atenga sent the study to RAIN News, and we spoke to CEO Per Sjofors to gain more context. He noted that there are “psychological price barriers” at different price points, which can be activated by price movements as small as one penny per month (e.g. from $4.99 to $5.00). That’s not fresh knowledge in retailing, of course, but Atenga applies survey science to find those mental tipping points.
“Pandora has a free service for $4.99/month, and a free service. If they would just price that at $5.00, one cent difference, both their market share and their revenue would go up. Our psychological price barriers are be positive or negative. Pandora is priced just under a so-called negative price barrier. If they increased the price, a greater percentage of people would say, ‘This is better quality, and I want to buy it.'”
In the survey work, Atenga used a questioning methodology called Van Westendorp Price Sensitivity Meter (PSM), invented by Dutch economist Peter van Westendorp in 1976.
“It consists four simple, unaided questions: First, at what price would they consider the service so low that they wouldn’t buy it, because they don’t believe the quality is there. Then, we ask what a too-high price is. Then you query for price points that would be bargains, and stretches. those four questions across a large enough survey group, you get price strategy curves. This is our business, to measure willingness to pay.”
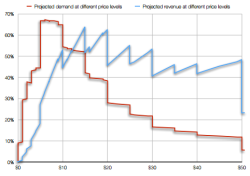 Atenga uses the PRM to arrive at so-called demand peaks and revenue peaks. The idea is to find the optimal sweet spot at which a company makes the most money, even if it drops some share along the way by raising (or lowering) price.
Across the board, taking “music streaming” as a whole (regardless of on-demand or non-interactive service models), Atenga found that demand peaks at $10/month, but revenue peaks at both $15 and $20. This is a kind of research result that would be interesting (and provocative) to insert into negotiations between labels and music services.
This methodology was applied to four streaming services individually: Pandora, YouTube, Spotify, and iTunes Radio. Results indicated that Spotify enjoys the highest willingness to pay, 25% higher than Pandora and YouTube. Spotify’s demand peak came in at $7/month — less than it charges now. So, lowering the price would increase share, according to the Atenga study. But the revenue peak is $15/month — at that price, the company would suffer a 20% reduction in share and a 20% gain in revenue, Atenga projects.
YouTube could charge $19.99/month for maximum revenue, according to this study, but Atenga recommended $9.99/month, which is the subscription price for YouTube’s Music Key (beta) plan.
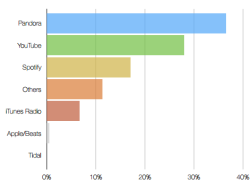 In the general survey questions, Pandora topped the list of preferred audio streaming platforms, followed by YouTube and then Spotify. The results also diverged from the commonly accepted trend toward mobile listening. Computers with speakers were the top hardware choice for listening to subscription audio, followed by smartphones with headphones. Listening to a smartphones in a car was a separate option, and ranked third. The results showed that YouTube was more popular on computers, while Spotify and iTunes Radio had a stronger showing on mobile.
The study included 857 responses.
This is a very interesting analysis and something the industry needs more of. I wonder if the population skew in the sample meant that early adopters of streaming were over-represented. We have seen newer users bias toward mobile and they represent a broader cross section of the population whereas early adopters have shown a greater willingness to pay. The best solution would be for Atenga to segment the responses based on mobile first vs desktop first users and indicate if and where there were differences. This may give us a better understanding of the pricing insights for the first 15% vs. the following 85% of users given that this runs counter to findings in previous studies.