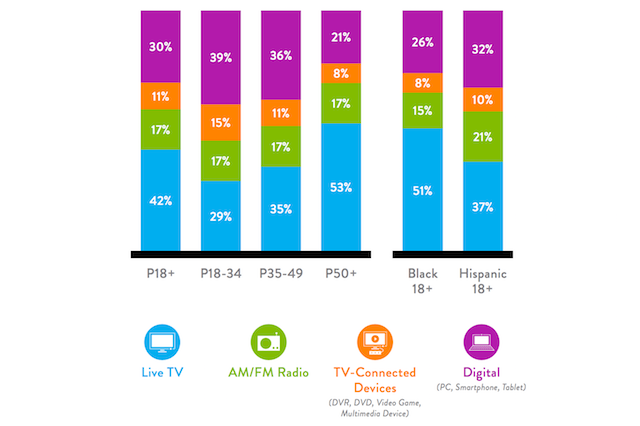
Share of average time spent per adult based on the total U.S. population
Nielsen’s Total Audience Report, released today, presents the latest data on radio’s U.S. listenership and how it compares to TV (including on-demand video and DVR watching) and general use of PCs, smartphones, and apps. The Total Audience Report is different from Nielsen’s Comparable Metrics Report, which also includes streaming audio as consumed through tablets and smartphones. As such, the Comparable Metrics Report gives us a more granular view of audio consumption, while the Total Audience Report covered here shows how audio is balanced against TV and the Internet in people’s days, weeks, and months.
AM/FM clearly has the widest reach — a notable and much-hammered metric in the radio industry. AM/FM’s monthly U.S. audience is 240-million. Compare that to Spotify’s global 100-million, and Pandora’s mostly-U.S. 80-million, and you see why broadcasters sometimes feel they don’t get enough respect (call-back to Rodney Dangerfield). On the other hand, U.S. radio is a $17-billion business, larger than the combined valuations of Spotify and Pandora.
Radio’s reach is a cleanly brag-worthy metric, while time spent listening (TSL) has more nuance.
The average time per day spent listening to radio is 1 hour, 52 minutes. The weekly average across the 12+ U.S. population is 12 hours and 26 minutes (12:26). Notably, the breakdowns by age shows a steady 17% share of average time spent in the 18-plus, 18-34, 35-49, and 50-plus groups. that means that each groups spends an average 17% of its media time (across measured media) with AM/FM. The other media types shift around by age group to keep the total at 100%. (See the chart at the top of this article.)
The nuance happens when you look at weekly TSL within the groups measure in time (hours:minutes). There, we see that the 12-17 group spends six hours and 17 minutes per week with AM/FM, while the 50-64 cohort spends over twice as much time listening to broadcast (15:09). It’s a steady downward TSL slide from older to younger in each measured group.
More demographic revelations lie in the ‘Digital’ statistic, which lumps together PCs, smartphones, and tablets. The average share for digital across all adults is 30%, but hits 39% for the 18-34 age group and 36% for 35-49. The 50+ group was just 21%. The younger groups gave a larger share to TV-connected devices, while the older respondents favored live TV.
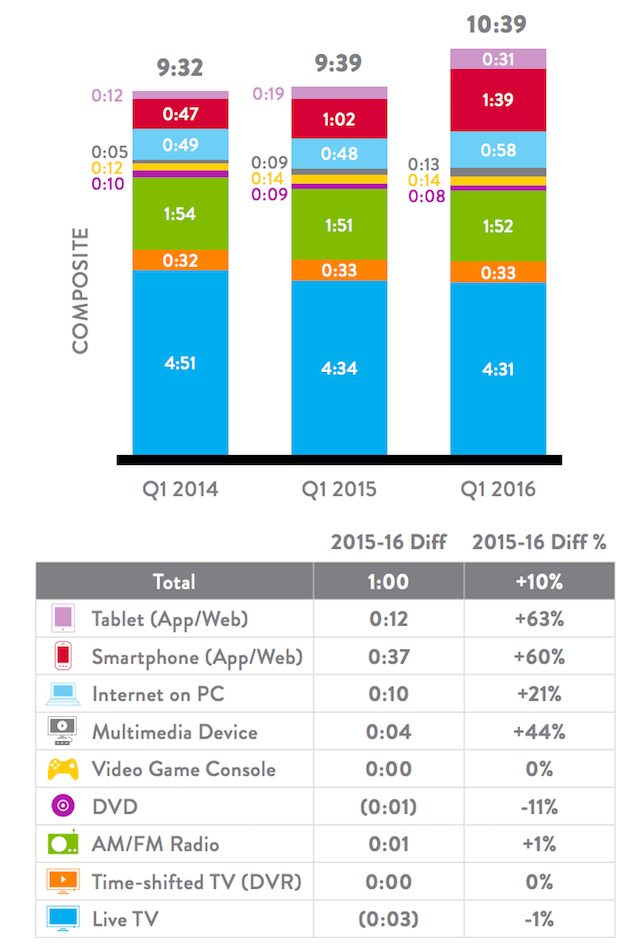
Average time spent per adult day based on the total U.S. population
Smartphone adoption is so vigorous that it transcends age groups, and this is an important point for audio generally. Across the board, smartphone/app use rose over 50% in time spent, from 7:20 per week to 11:36. Every age group participated in that robust increase of use.